|
If you are using Intravue for a short term audit or network assessment you may not care about the admin verification features. If you are using Intravue to maintain network documentation and resolve network issues you should have the goal of all known devices being admin verified at their validated switch locations. Admin verification accomplishes the following:
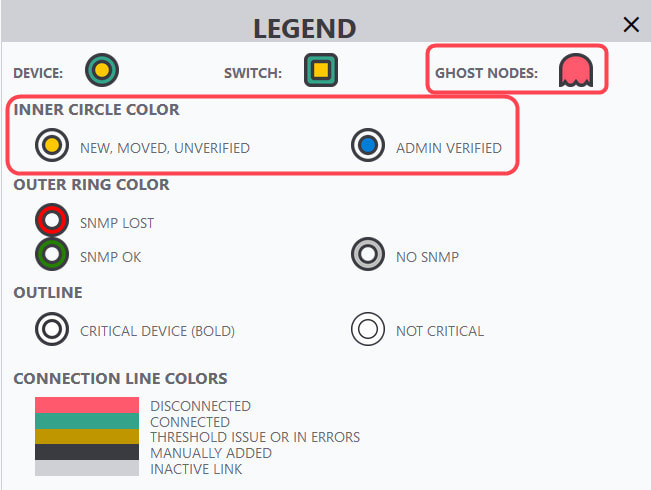
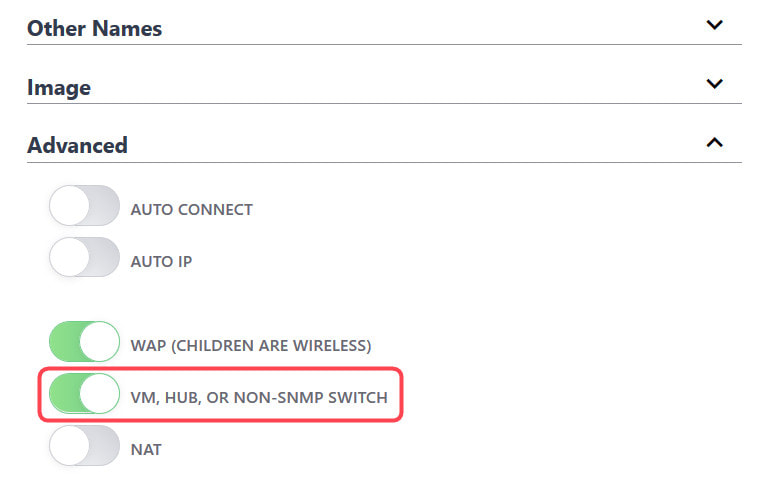
As the new legend in IntraVUE will show, there inside color of a device will indicate one of three states.
In the ideal case, when you view the IntraVUE map, every node will have a blue center. This tells you every device is at its verified position and no changes to mac, model, or version numbers. Any device having a yellow center will indicate a new device or a changed device with details in its sidebar. 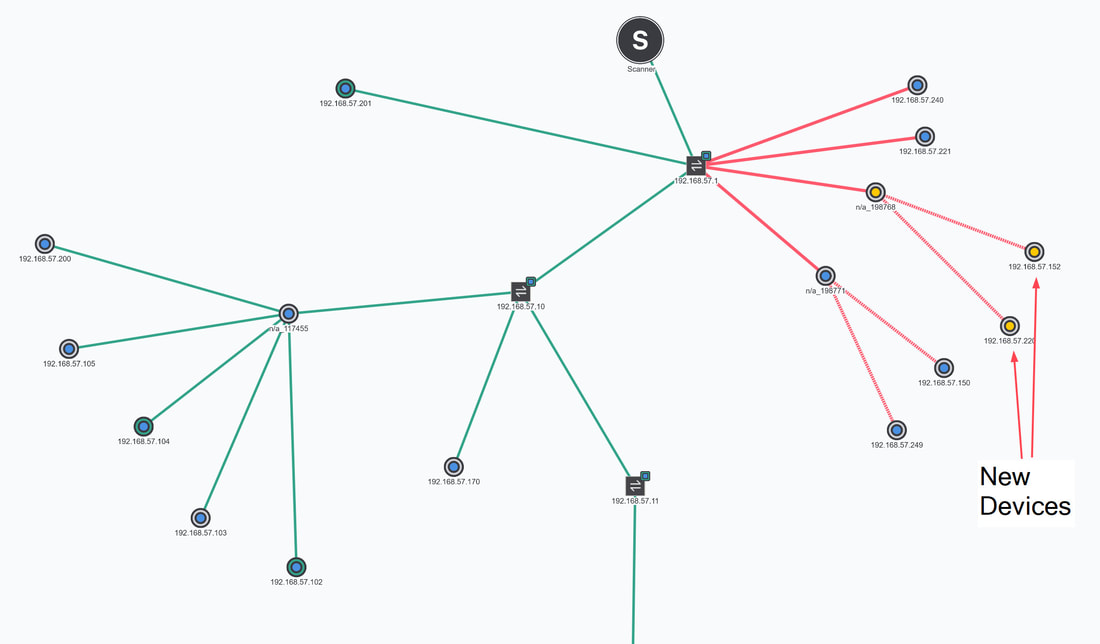 Methods of Verification1. Editing the admin state in the sidebar 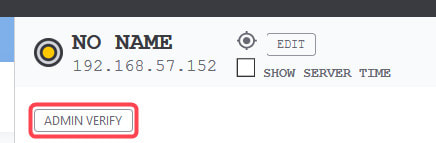 2. Editing the admin state in the Device List 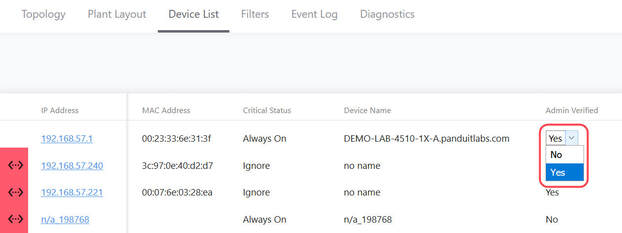 3. In bulk, using Export Database, modifying the 'Verified' column, Import the modified CSV file, 1 equals verified. 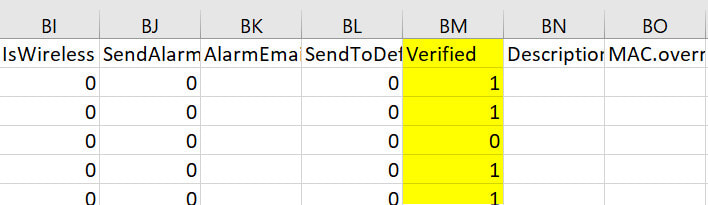 4. Using 'Admin Verify All' in the Configure / Scanner tab. This verifies every device having an IP to its current position. Note 'n/a' nodes are not verified, the admin must decide the validity of the n/a node. 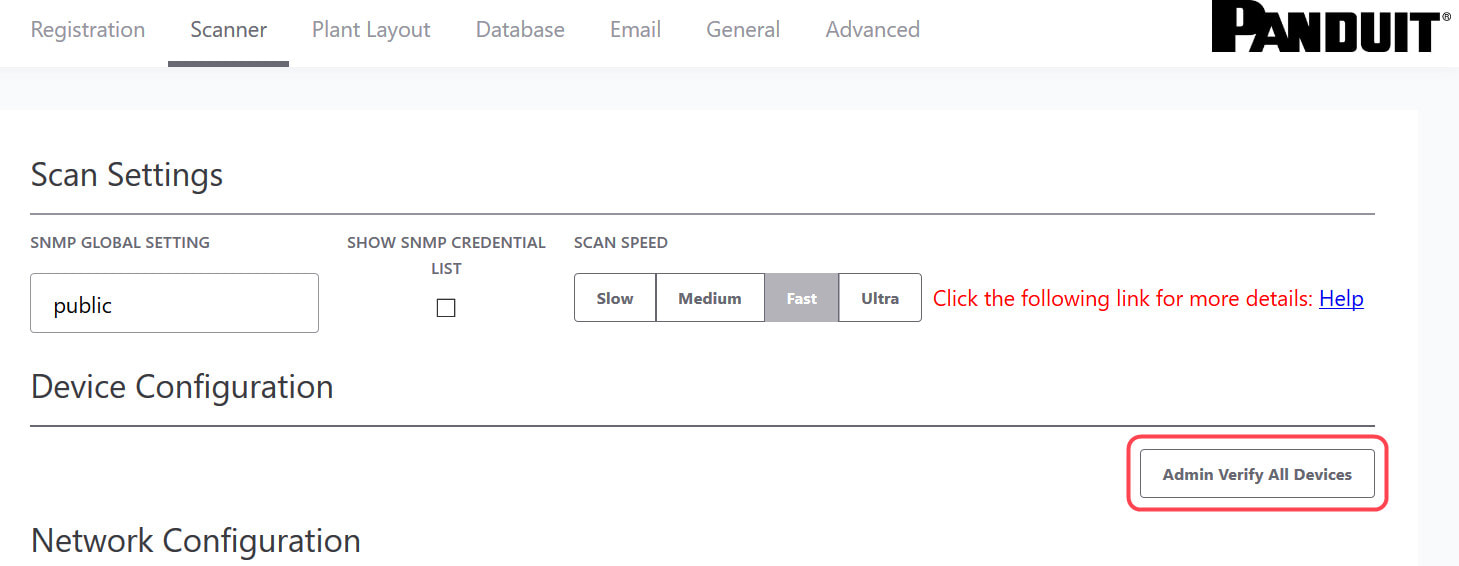 Why aren't n/a nodes verified by 'Verify All Devices'.'n/a' nodes will only appear on a port of a managed switch. When Intravue discovers more than one mac address reported by a managed switch on a port and there isn't a managed switch under that same port to claim that mac, it means something is allowing two or more devices to be connected to the same port. In order for two or more devices to appear on the port of a managed switch, some device or technology is allowing this to happen. IntraVUE only has the information from managed switches to determine topology, the reason more than one mac may appear on a port could be:
 The IntraVUE administrator should determine the cause of any n/a node and take action that results in either the n/a node going away or admin verifying the node manually with a description indicating to others what the situation is, for instance 'Unmanaged NTRON Switch'. If you have a large number of n/a nodes and need help understanding the cause, please contact WBC-INS.
0 Comments
This article will explain the benefits of IntraVUE's KPI feature and how to use and improve it, In IntraVUE every device has a critical state of ‘unknown’ when discovered. An administrator must take time to set devices into 'states'. There must be a benefit for spending this time. The states available for a device are:
BenefitsThe main benefits of setting devices to a critical or non-critical states are:
In this section I will show you some of the benefits of using the KPI functionality and then how to best configure IntraVUE to use KPI. KPI data is calculated in real time each time you visit a KPI page under the Analytics tab. If you change a device's KPI state, the last 30 days of will now reflect the changed state of that device.  The image above shows 30 days of uptime statistics for devices set to 'always on' and the daily total incidents for both 'always on' and 'intermittent' devices broken down between switches and devices.  The image above shows how the past 24-hours compares to the previous 30 one day periods, recalculated every two minutes. Today's critical device Uptime is better than average, compared to the last 30 days (details in sidebar). In the last 24 hours the number of critical Switch Incidents is worse and should be investigated if the reason is not known.  KPI is available and comparable on a network basis showing the current, average, min and max values for uptime, switch incidents, and device incidents.  By selecting a network you may see the same data on a device basis. You may select to see all or only critical devices. How to use KPIThere are five major steps to using KPI and IntraVUE Analytics. Each step will be explained. 1) Set all devices in the unknown state into one of the other 3 states 2) Set the event types that are considered incidents 3) Set realistic threshold values 4) View the critical performance analytic graphs and events 5) Understand and take action on anomolies 1) Set the KPI state for all unknown devicesThere are several ways to change a devices state. Two of the best ways are by using the Export/Import mechanism or by using the View / Device List.  Above is a spreadsheet with most of the exported columns removed, leaving the 'PKI.critical' column on the right. (PKI is internally the same as KPI) An empty cell or a 0 cell is an ignore state, 1 is ignore, 2 is intermittent, and 3 is always on. You may sort the data by IP, switch port, name, etc as an aid to completing the task.  A dropdown control in Device List allows changing a device's KPI critical state. The list is sortable by any column. 2) Set the event types that are considered incidents.By default almost every event that appears in the event log for a device is counted as an incident. There is a setting in the ivserver.properties file which controls which events become incidents in IntraVUE. The default is below. # comma separated list of event log classes to exclude from KPI calculations kpi.class.exclude=101,35 Notice that these are the class of events to exclude. I have created a document, IntraVUE Event Codes and Use with KPI, which shows all the event codes/classes and which ones are best used for KPI. The entry if only the relevant events in the document are used for KPI incident calculations would be as below. kpi.class.exclude=1,2,3,4,5,7,9,13,17,23,25,26,27,28,29,30,31,35,33,34,36,37,105,108,110,113 3) Set realistic threshold valuesThe problem with threshold values is that they are assigned upon discovery and before any perfomrance history is known. In Configuration / Advanced you will find the defaults assigned any new device, typically 30 msec for ping response time and 30 % for transmit and receive bandwidth. Users rarely change ping or bandwidth response time unless it is to make them higher for wireless device pings or the odd server's or switch's bandwidth. A PLC or server normally responding in less than 2 msec and almost never over 5 msec will typically still have 30 msec set as it's threshold. Ideally a device's ping response times fluctuate within a range and the upper limit is rarely exceeded except under stress or problems.  The only way to change a device's threshold setting is to select a connecting line to bring up the sidebar and then 'edit' in the heading.
For the device shown above left the ping response was not over 1 msec for the last 6 hours with one spike to around 0.8. It would be good to set the ping response for this device to a low number, such as 2 msecs instead of 30 msec. For the same rationale if a device is generating constant event log messages that its ping response threshold is being exceeded, the threshold value should be increased to something near its peak responses. In the above right image the default ping response time of 30 msec was exceeded 11 times in the last 6 hours. For this device a ping response threshold between 80 and 100 would be more appropriate. You do not want to set the threshold so high that it is never exceeded. If all devices had 'good' thresholds a network issue might show up by seeing a large number of devices over threshold. Unfortunately there isn't a better way to adjust thresholds other than in Configuration / Advanced / Adjust Ping Thresholds. This will increase any device that has exceeded its threshold to a value equal to 10 msec greater than the last 2 hour maximum. This is not recommended by WBC-INS. WBC-INS is looking into developing a tool or tools to better manage ping and bandwidth thresholds. Please let us know if you think this would be a good thing. 4) View the critical performance graphs and eventsWith your new knowledge of which events make up the KPI incidents and having identified devices which are critical to the operation of your business you will find new value from IntraVUE. The graphs shown in the Benefits section are accessed by selecting Analyze. The 'KPI' tab provides buttons for the Daily Graph comparing the last 24 hours to the previous 24 hour periods in the last month and the 30 day graphs showing each days Uptime and Incidents. The 'KPI by Network' tab provides access to both the network by network statistics as well as the individual devices within a network when that network is selected in the upper panel. As devices are added or removed as critical or their state's changed the graphs will change to reflect the new settings including all the data for the last 30 days. You will see your updates immediately. 5) Understand and take action on anomaliesPeriodically review the graphs and when you see either a increase of decrease for the normal trends you should have an understanding of why that happened. If you don't understand you will learn more about your network if you take the time to investigate.
If you need help please contact WBC Industrial Network Services. |