
Network Health Monitor
WBC Network Health Monitor
A full-fledged application that improves the Topology and Plant Views of IntraVUE™ and leverages IntraVUE data to make maintaining Ethernet networks easier and proactive.
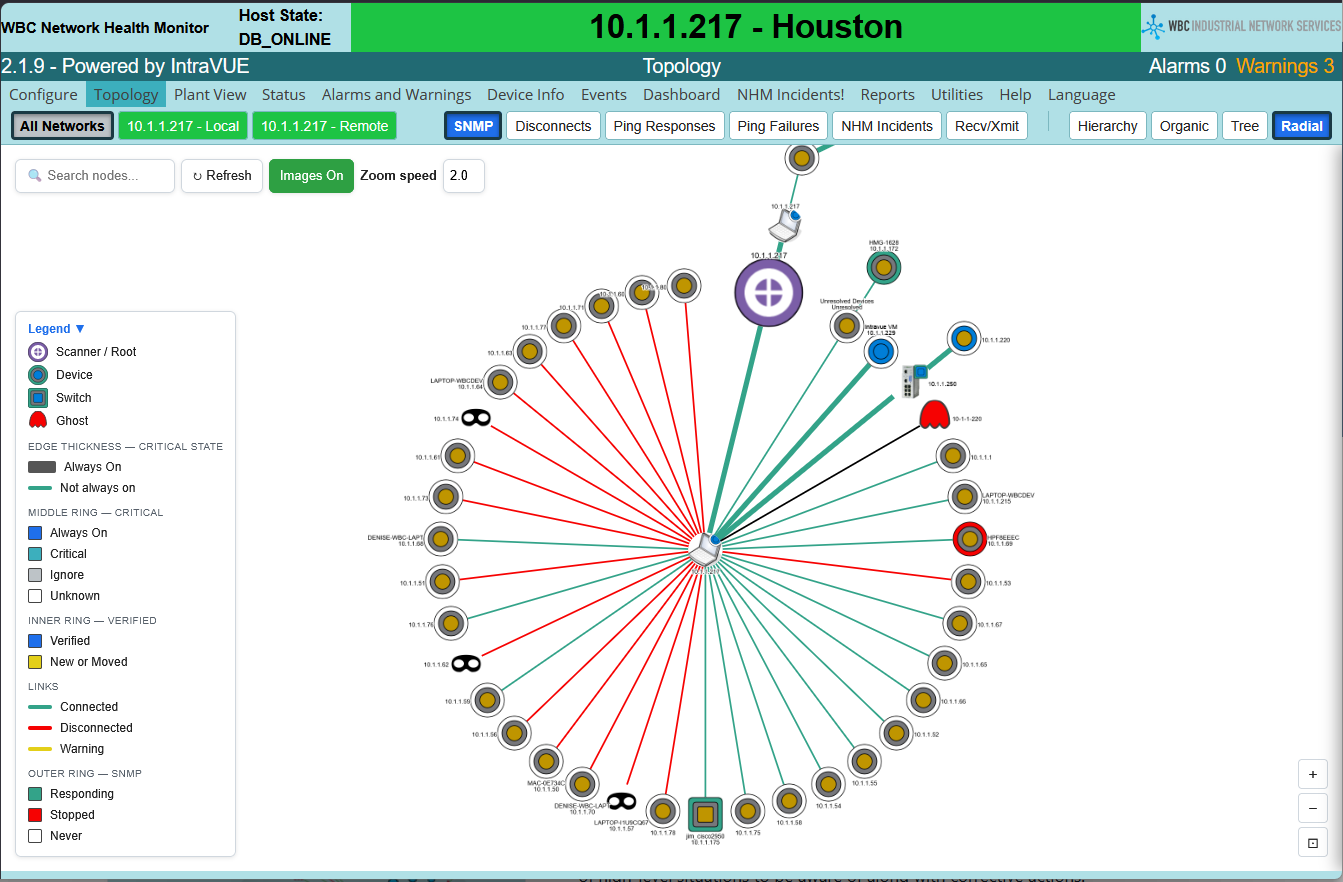
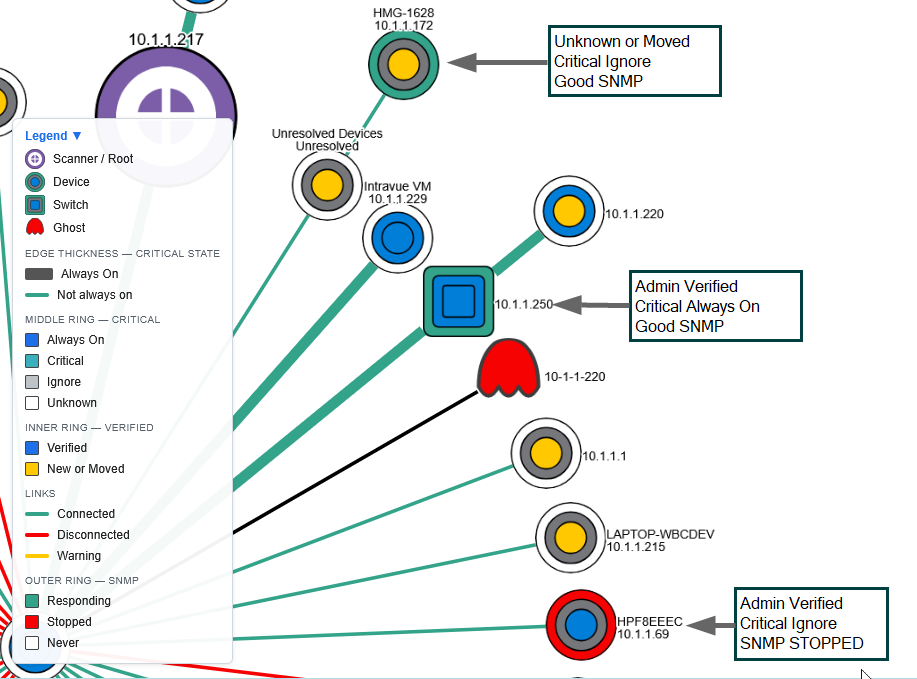
The Topology Map of the NHM adds a third ring to the two in IntraVUE. The innermost shows the admin verified state, the middle ring shows the Critical state of the device, and the outer ring varies by six ways of looking at the devices.
- SNMP — shows how the device is responding to SNMP requests. This view is similar to IntraVUE's Topology.
- DISCONNECTS — shows the frequency of disconnections during the selected period.
- PING RESPONSES — shows the average ping response during the period.
- PING FAILURES — shows the number of minutes during the period the device had a ping failure.
- NHM INCIDENTS — shows the number of Network Health Monitor incidents during the period.
- RECV/XMIT — can show average or maximum bandwidth, or bytes sent and received.
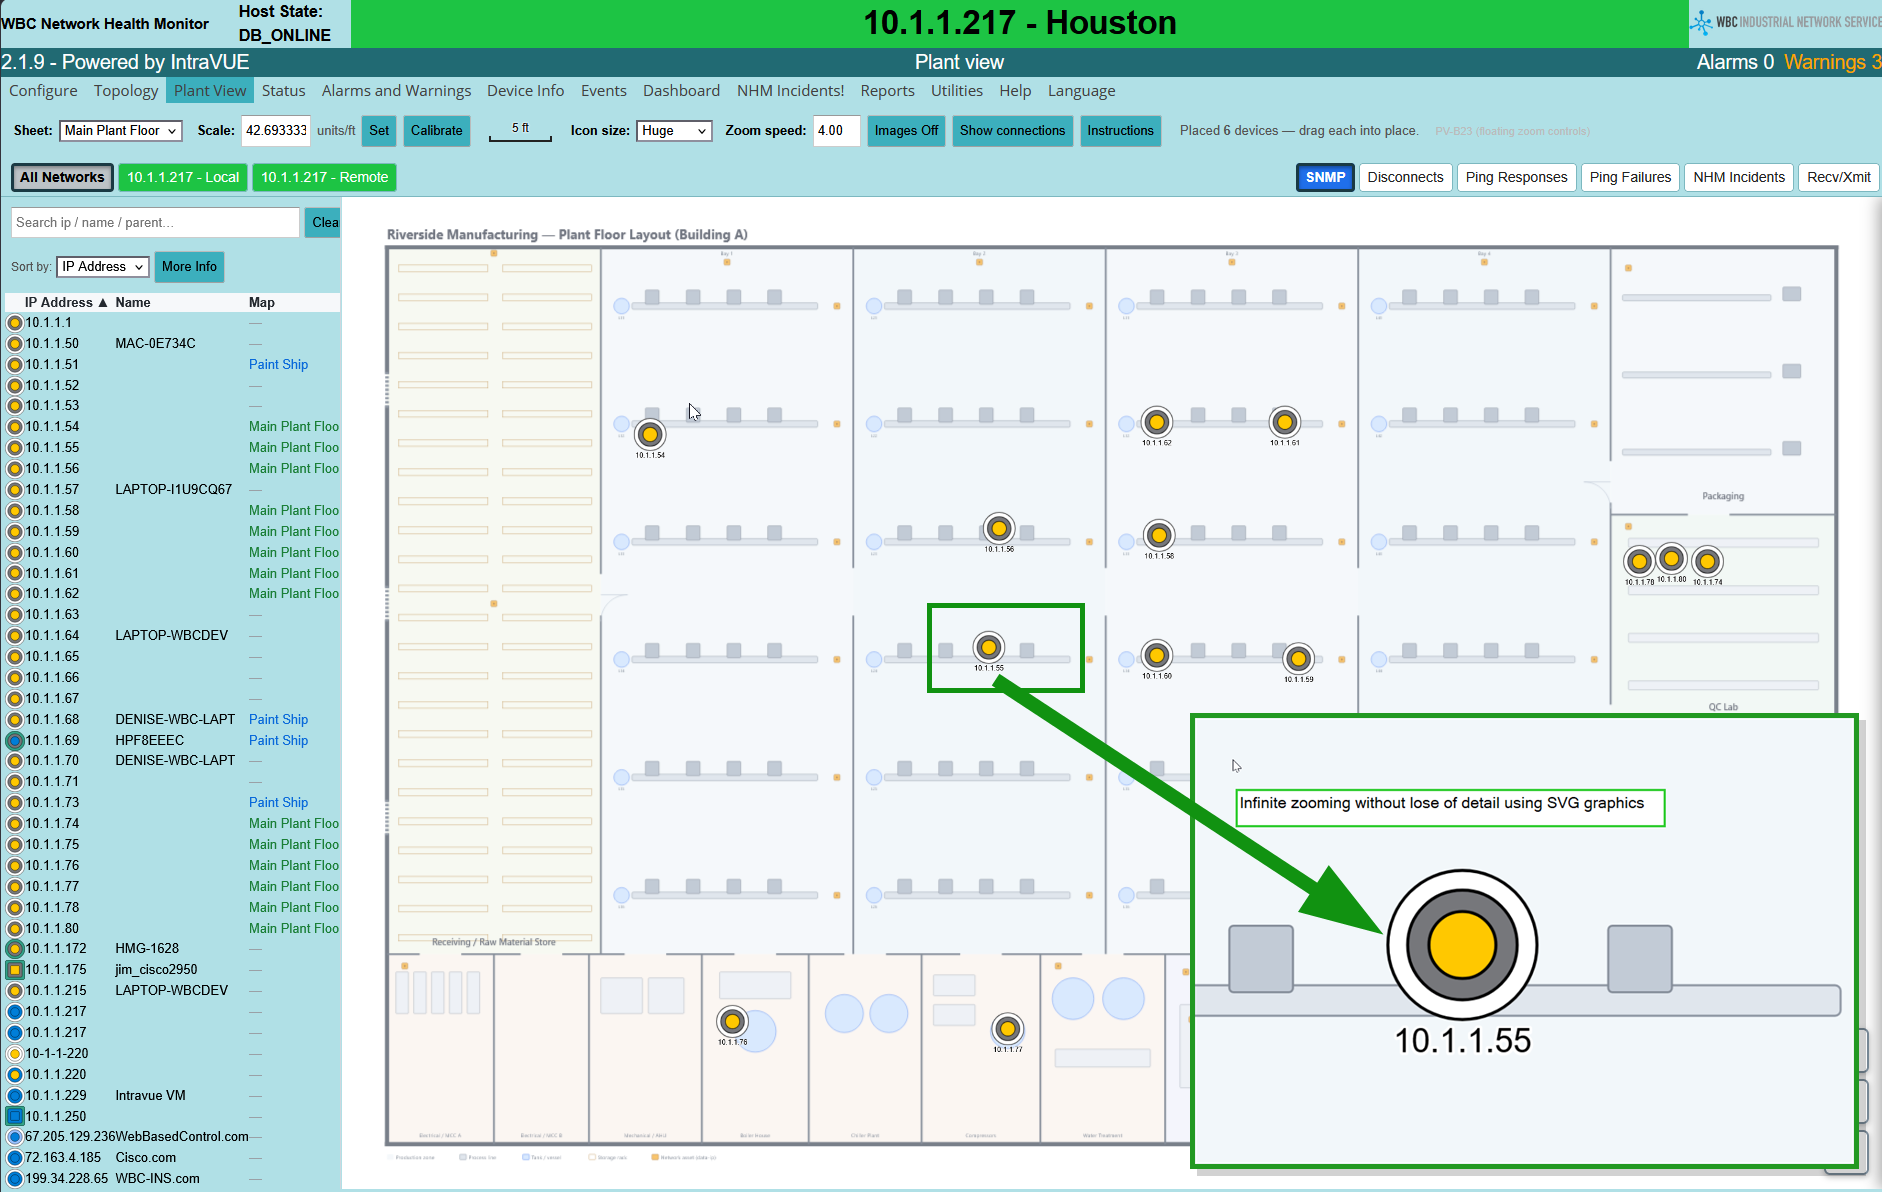
The NHM's Plant View uses SVG graphics as the basis for the plant view. This allows the NHM Plant View to zoom in infinitely without losing any detail. The IntraVUE Plant View uses low resolution raster images which become blurred when zoomed in. The NHM Plant View also allows multiple SVG images for those plants distributed over multiple floors or buildings.
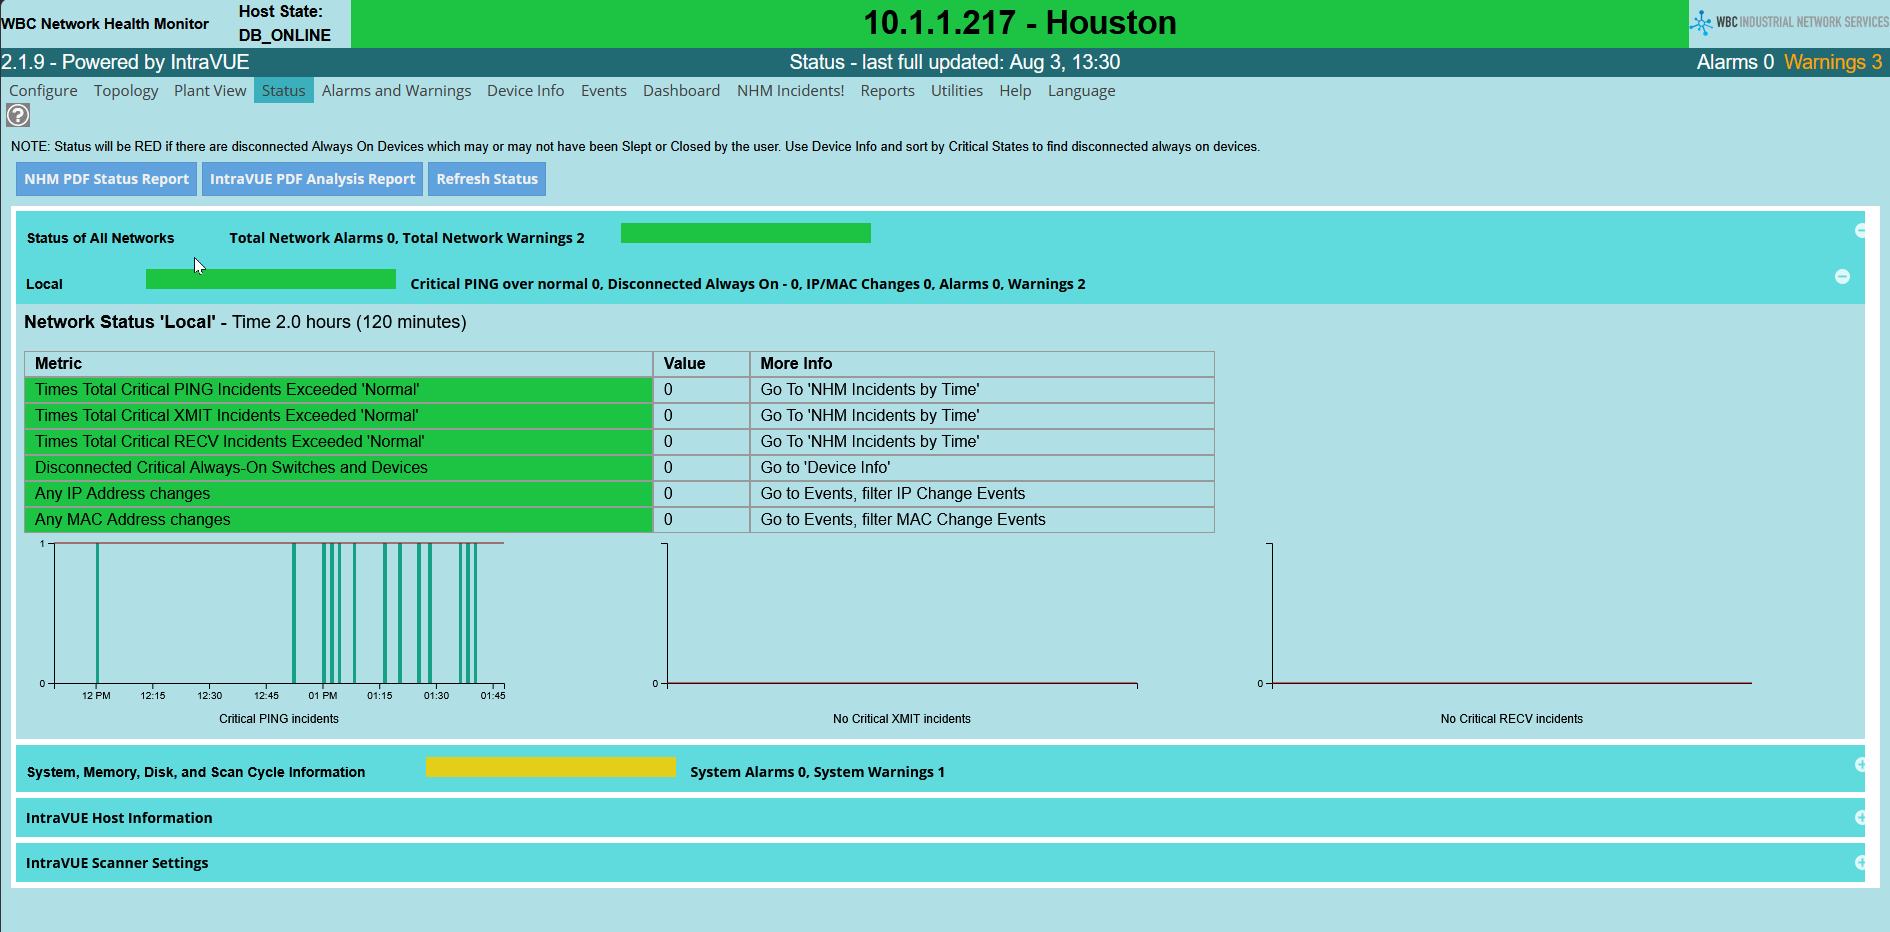
A Status Page shows the current health of each IntraVUE network, the status of memory, host disk space, IntraVUE scanner speed, IntraVUE SNMP collection speed, alarms, and more. The overall data collected by IntraVUE is used to provide a simple overall indicator of network health for each IntraVUE network. The PDF report can be generated immediately and is displayed in a new browser window as well as saved to disk. The report shows the detailed status of each network and a summary of high-level situations to be aware of along with corrective actions.
NHM is focused on the critical devices and provides utilities to make setting the critical state of devices easy and semi-automatic. NHM creates statistics modeling the 'normal' behavior of each device for each hour of the week. At any time it is expected some devices will exceed their normal behavior, creating an NHM Incident, but not 'many' devices. When many devices are exceeding this 'normal' behavior an alarm is generated to let the user know an unusual situation is happening in the network.
Over 20 proactive alarms and warnings are created through analysis of the IntraVUE database or collected from the host computer. Alarms and warnings are monitored and automatically cleared as appropriate. All alarms and warnings are logged to the NHM database, and alarms are emailed as they occur.
Sample proactive alarms
NHM discovers cloaked devices that do not respond to the IntraVUE Scanner's ping requests, creating events when these devices are discovered and when they age in and out of the relevant ARP caches. A few of the alarms:
- New device IP address as well as new device MAC address
- Critical device disconnections (no configuration)
- Duplicate IPs
- Cloaked devices (not responding to ping requests)
- Successive minutes where ~30% of the critical devices have exceeded their NHM incident normal behavior
- Scanner — stopped, speed too slow, registration issues
Map Types
The 6 device views above can be shown using 3 Map Types:
- Radial, the default, where lines do not cross
- Organic, clusters devices around their parents
- Tree, like an organization chart
Reports
- Instant PDF Status Report
- Uptime Report
- Threshold Analysis
- CRC and IfInErrors Reports
- Connection History Report
- Disconnections Report
- Ping Failures Report
- Enhanced Switch Probe Reports
Utilities
- Quick Check to fix easily fixable IntraVUE issues
- Device Editor
- Critical State Recommendations and Critical State Management
- Create Clean Database with scanner settings retained
- Vendor Code Management
- Manage Disabled Alarms
- Log file viewer